k8s prometheus监控

  |  

全部的 K8S学习笔记总目录,请点击查看。

Prometheus 是一个开源监控系统,它本身已经成为了云原生中指标监控的事实标准,本文主要介绍k8s集群监控的安装和配置。

k8s集群监控体系演变史

k8s集群监控体系主要经历了三个版本的演变:

第一版本:Cadvisor+InfluxDB+Grafana

只能从主机维度进行采集,没有Namespace、Pod等维度的汇聚功能

第二版本: Heapster+InfluxDB+Grafana

heapster负责调用各node中的cadvisor接口,对数据进行汇总,然后导到InfluxDB,可以从cluster,node,pod的各个层面提供详细的资源使用情况。

monitor-earlier

第三版本:Metrics-Server + Prometheus

custom-hpa

监控接口标准化

k8s对监控接口进行了标准化,主要分了三类:

  1. Resource Metrics

    metric-api对应的接口是 metrics.k8s.io,主要的实现就是 metrics-server,它提供的是资源的监控,比较常见的是节点级别、pod 级别、namespace 级别、class 级别。这类的监控指标都可以通过 metrics.k8s.io 这个接口获取到

  2. Custom Metrics
    对应的接口是 custom.metrics.k8s.io,主要的实现是 Prometheus, 它提供的是资源监控和自定义监控,资源监控和上面的资源监控其实是有覆盖关系的。

    自定义监控指的是:比如应用上面想暴露一个类似像在线人数,或者说调用后面的这个数据库的 MySQL 的慢查询。这些其实都是可以在应用层做自己的定义的,然后并通过标准的 Prometheus 的 client,暴露出相应的 metrics,然后再被 Prometheus 进行采集

  3. External Metrics

    对应的接口是 external.metrics.k8s.io。主要的实现厂商就是各个云厂商的 provider,通过这个 provider 可以通过云资源的监控指标

Prometheus架构

prometheus

  1. Prometheus Server ,监控、告警平台核心,抓取目标端监控数据,生成聚合数据,存储时间序列数据
  2. exporter,由被监控的对象提供,提供API暴漏监控对象的指标,供prometheus 抓取
    • node-exporter
    • blackbox-exporter
    • redis-exporter
    • mysql-exporter
    • custom-exporter
  3. pushgateway,提供一个网关地址,外部数据可以推送到该网关,prometheus也会从该网关拉取数据
  4. Alertmanager,接收Prometheus发送的告警并对于告警进行一系列的处理后发送给指定的目标
  5. Grafana:配置数据源,图标方式展示数据

Prometheus安装

Prometheus基于go开发,项目地址在这里

docker 启动

真正部署到k8s之前,我们可以先使用docker启动一个prometheus实例,这样可以方便我们进行测试,我们先看一下它启动需要什么参数可以供我们修改。

使用docker部署直接启动镜像即可:

1
$ docker run --name prometheus -d -p 127.0.0.1:9090:9090 prom/prometheus:v2.48.0

接下来我们去容器内容查看一下默认的启动命令:

1
2
3
4
5
6
7
8
9
10
11
12
13
14
15
16
17
18
19
20
21
22
23
24
25
26
27
28
29
30
31
32
33
34
35
36
37
38
$ docker run -d --name prometheus -p 9090:9090 prom/prometheus:v2.48.0
$ docker exec -it prometheus sh
/prometheus $ ps aux
PID USER TIME COMMAND
1 nobody 0:00 /bin/prometheus --config.file=/etc/prometheus/prometheus.yml --storage.tsdb.path=/prometheus --web.console.libraries=/usr/share/prometheus/console_libraries --web.console.templates=/usr/share/prometheu
26 nobody 0:00 sh
32 nobody 0:00 ps aux

#/ cat /etc/prometheus/prometheus.yml
# my global config
global:
scrape_interval: 15s # Set the scrape interval to every 15 seconds. Default is every 1 minute.
evaluation_interval: 15s # Evaluate rules every 15 seconds. The default is every 1 minute.
# scrape_timeout is set to the global default (10s).

# Alertmanager configuration
alerting:
alertmanagers:
- static_configs:
- targets:
# - alertmanager:9093

# Load rules once and periodically evaluate them according to the global 'evaluation_interval'.
rule_files:
# - "first_rules.yml"
# - "second_rules.yml"

# A scrape configuration containing exactly one endpoint to scrape:
# Here it's Prometheus itself.
scrape_configs:
# The job name is added as a label `job=<job_name>` to any timeseries scraped from this config.
- job_name: 'prometheus'

# metrics_path defaults to '/metrics'
# scheme defaults to 'http'.

static_configs:
- targets: ['localhost:9090']

从上面的结果可以看到prometheus的启动命令是:

1
/bin/prometheus --config.file=/etc/prometheus/prometheus.yml --storage.tsdb.path=/prometheus --web.console.libraries=/usr/share/prometheus/console_libraries --web.console.templates=/usr/share/prometheus/consoles

其中,我们可以看到几个关键的参数:

  • –config.file:配置文件路径,配置了哪些指标需要采集,采集的频率是多少等
  • –storage.tsdb.path:tsdb数据存储路径
  • –web.console.libraries:prometheus的web控制台的静态文件路径
  • –web.console.templates:prometheus的web控制台的模板文件路径

其他常用参数:

  • –web.enable-lifecycle:支持热更新,直接执行localhost:9090/-/reload立即生效
  • –web.enable-admin-api:支持admin api,可以通过api来获取prometheus的一些信息
  • –web.route-prefix:prometheus的ui/api的前缀
  • –web.external-url:prometheus的ui/api的外部访问地址
  • –web.page-title:prometheus的web控制台的标题
  • –web.max-connections:prometheus的web控制台的最大连接数

k8s部署

我们通过docker启动已经知道了prometheus的启动参数,接下来我们就可以通过k8s来部署prometheus了。

首先准备所需的资源清单,比如配置文件,数据库的pvc资源,rbac资源,deployment资源,service资源,ingress资源等。

1
2
3
4
5
6
7
8
9
10
11
12
13
14
15
16
17
18
19
20
21
22
23
24
25
26
27
28
29
30
31
32
33
34
35
36
37
38
39
40
41
42
43
44
45
46
47
48
49
50
51
52
53
54
55
56
57
58
59
60
61
62
63
64
65
66
67
68
69
70
71
72
73
74
75
76
77
78
79
80
81
82
83
84
85
86
87
88
89
90
91
92
93
94
95
96
97
98
99
100
101
102
103
104
105
106
107
108
109
110
111
112
113
114
115
116
117
118
119
120
121
122
123
124
125
126
127
128
129
130
131
132
133
134
135
136
137
138
139
140
141
142
143
144
145
146
147
148
149
150
151
152
153
154
155
156
157
158
159
160
161
162
163
164
165
166
167
168
169
170
171
172
173
174
175
176
177
178
179
180
181
182
183
184
185
186
187
188
189
190
191
192
193
194
195
196
197
198
199
200
201
202
203
204
205
206
207
208
209
210
211
# 配置文件,使用configmap的形式保存,覆盖默认的配置文件
$ cat prometheus-cm.yml
# my global config
global:
scrape_interval: 30s
evaluation_interval: 30s
# scrape_timeout is set to the global default (10s).

# Alertmanager configuration
alerting:
alertmanagers:
- static_configs:
- targets:
# - alertmanager:9093

# Load rules once and periodically evaluate them according to the global 'evaluation_interval'.
rule_files:
# - "first_rules.yml"
# - "second_rules.yml"

# A scrape configuration containing exactly one endpoint to scrape:
# Here it's Prometheus itself.
scrape_configs:
- job_name: 'prometheus'
static_configs:
- targets: ['localhost:9090']


# 数据库的pvc资源
$ cat prometheus-pvc.yaml
kind: PersistentVolumeClaim
apiVersion: v1
metadata:
name: prometheus
namespace: monitor
spec:
accessModes:
- ReadWriteOnce
storageClassName: nfs-client
resources:
requests:
storage: 200Gi


# prometheus的资源文件
# 需要防止出现Prometheus数据存储权限问题,因为Prometheus内部使用nobody启动进程,挂载数据目录后权限为root,因此使用initContainer进行目录权限修复:
$ cat prometheus-deployment.yaml
apiVersion: apps/v1
kind: Deployment
metadata:
name: prometheus
namespace: monitor
labels:
app: prometheus
spec:
selector:
matchLabels:
app: prometheus
template:
metadata:
labels:
app: prometheus
spec:
serviceAccountName: prometheus
initContainers:
- name: "change-permission-of-directory"
image: busybox
command: ["/bin/sh"]
args: ["-c", "chown -R 65534:65534 /prometheus"]
securityContext:
privileged: true
volumeMounts:
- mountPath: "/etc/prometheus"
name: config-volume
- mountPath: "/prometheus"
name: data
containers:
- image: prom/prometheus:v2.48.0
name: prometheus
args:
- "--config.file=/etc/prometheus/prometheus.yml"
- "--storage.tsdb.path=/prometheus" # 指定tsdb数据路径
- "--web.enable-lifecycle" # 支持热更新,直接执行localhost:9090/-/reload立即生效
- "--web.console.libraries=/usr/share/prometheus/console_libraries"
- "--web.console.templates=/usr/share/prometheus/consoles"
ports:
- containerPort: 9090
name: http
volumeMounts:
- mountPath: "/etc/prometheus"
name: config-volume
- mountPath: "/prometheus"
name: data
resources:
requests:
cpu: 100m
memory: 512Mi
limits:
cpu: 100m
memory: 512Mi
volumes:
- name: data
persistentVolumeClaim:
claimName: prometheus
- configMap:
name: prometheus-config
name: config-volume


# rbac,prometheus会调用k8s api做服务发现进行抓取指标
$ cat prometheus-rbac.yaml
apiVersion: v1
kind: ServiceAccount
metadata:
name: prometheus
namespace: monitor
---
apiVersion: rbac.authorization.k8s.io/v1
kind: ClusterRole
metadata:
name: prometheus
rules:
- apiGroups:
- ""
resources:
- nodes
- services
- endpoints
- pods
- nodes/proxy
verbs:
- get
- list
- watch
- apiGroups:
- "extensions"
resources:
- ingresses
verbs:
- get
- list
- watch
- apiGroups:
- ""
resources:
- configmaps
- nodes/metrics
verbs:
- get
- nonResourceURLs:
- /metrics
verbs:
- get
---
apiVersion: rbac.authorization.k8s.io/v1
kind: ClusterRoleBinding
metadata:
name: prometheus
roleRef:
apiGroup: rbac.authorization.k8s.io
kind: ClusterRole
name: prometheus
subjects:
- kind: ServiceAccount
name: prometheus
namespace: monitor


# 提供Service,为Ingress使用
$ cat prometheus-svc.yaml
apiVersion: v1
kind: Service
metadata:
name: prometheus
namespace: monitor
labels:
app: prometheus
spec:
selector:
app: prometheus
type: ClusterIP
ports:
- name: web
port: 9090
targetPort: http


# 创建访问的ingress资源
$ cat prometheus-ingress.yaml
apiVersion: networking.k8s.io/v1
kind: Ingress
metadata:
name: prometheus
namespace: monitor
spec:
rules:
- host: prometheus.test.com
http:
paths:
- path: /
pathType: Prefix
backend:
service:
name: prometheus
port:
number: 9090

部署上述资源:

1
2
3
4
5
6
7
8
9
10
11
12
13
14
15
16
17
18
19
20
# 命名空间
$ kubectl create namespace monitor

# 创建cm
$ kubectl -n monitor create cm prometheus-config --from-file=prometheus.yml=prometheus-cm.yml

# 创建pvc
$ kubectl apply -f prometheus-pvc.yaml

# 创建rbac
$ kubectl apply -f prometheus-rbac.yaml

# 创建deployment
$ kubectl apply -f prometheus-deployment.yaml

# 创建svc
$ kubectl apply -f prometheus-svc.yaml

# 创建ingress
$ kubectl apply -f prometheus-ingress.yaml

等待pod启动完成后,我们就可以通过ingress访问prometheus了:

1
2
3
4
5
6
7
8
9
10
11
$ kubectl -n monitor get po -o wide

$ kubectl -n monitor logs prometheus-5bc5966ff8-f84vx
......
ts=2023-12-01T11:43:56.696Z caller=main.go:1048 level=info msg="TSDB started"
ts=2023-12-01T11:43:56.696Z caller=main.go:1229 level=info msg="Loading configuration file" filename=/etc/prometheus/prometheus.yml
ts=2023-12-01T11:43:56.697Z caller=main.go:1266 level=info msg="Completed loading of configuration file" filename=/etc/prometheus/prometheus.yml totalDuration=1.610796ms db_storage=2.624µs remote_storage=3.863µs web_handler=1.187µs query_engine=1.973µs scrape=786.861µs scrape_sd=80.748µs notify=79.645µs notify_sd=28.501µs rules=3.403µs tracing=12.743µs
ts=2023-12-01T11:43:56.698Z caller=main.go:1009 level=info msg="Server is ready to receive web requests."
.....

$ curl http://prometheus.test.com

prometheus的数据

部署完成后,我们可以访问prometheus的web控制台,查看prometheus的数据。

k8s-prometheus-ui-page

然后我们选择进入targets页面,查看prometheus的默认targets:

k8s-prometheus-ui-choose-targets

k8s-prometheus-ui-targets-page

可以看到prometheus默认采集了一些k8s的指标,这里只有一个endpoint是 http://localhost:9090/metrics ,这个是prometheus自身的指标。

我们可以通过访问这个endpoint来查看prometheus自身的指标:

1
2
3
4
5
6
7
8
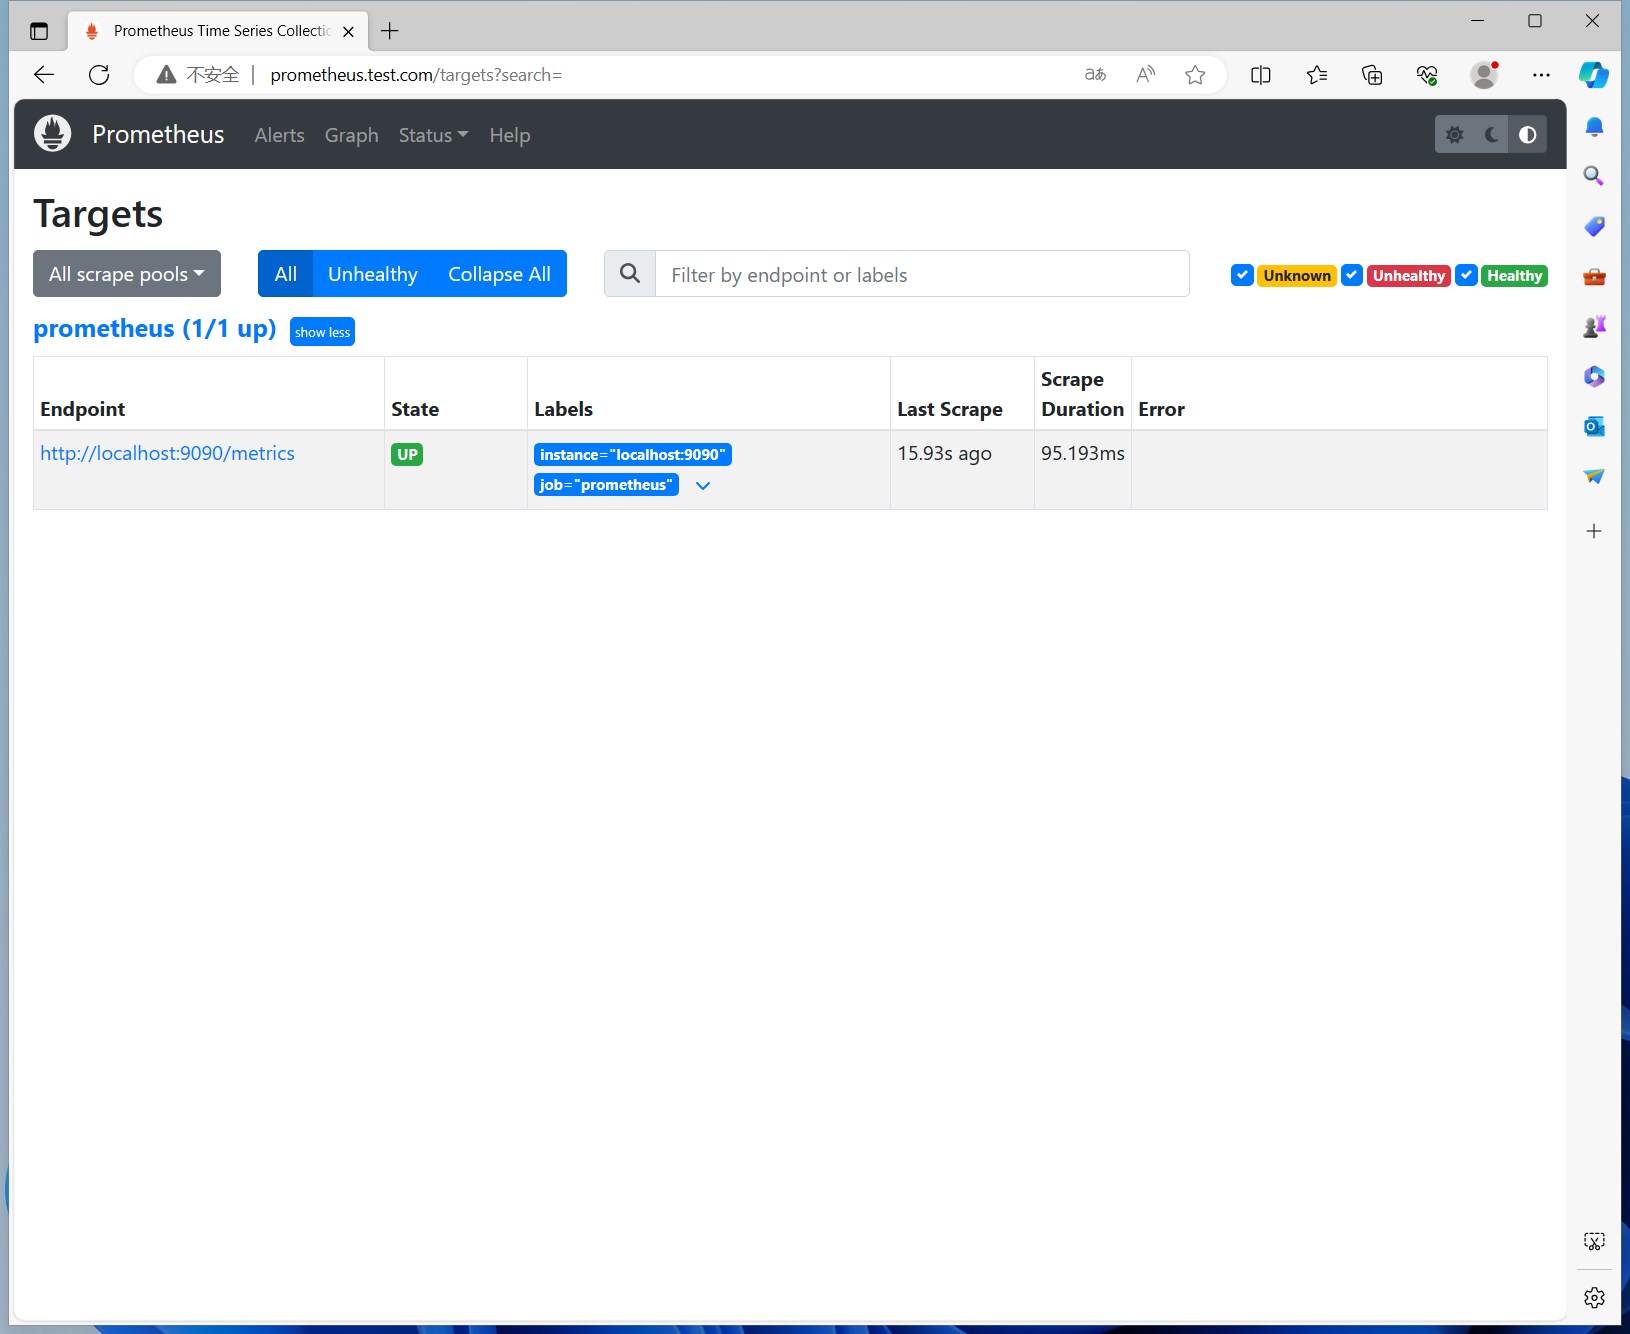
$ curl http://prometheus.test.com/metrics
......
# HELP promhttp_metric_handler_requests_total Total number of scrapes by HTTP status code.
# TYPE promhttp_metric_handler_requests_total counter
promhttp_metric_handler_requests_total{code="200"} 152
promhttp_metric_handler_requests_total{code="500"} 0
promhttp_metric_handler_requests_total{code="503"} 0
......

可以看到返回的监控数据格式都比较固定,那它们怎么存储呢?接下来我们就来看一下prometheus的数据存储。

时间序列数据库(TSDB)

初识TSDB

1
2
3
4
5
6
7
8
9
10
11
12
13
# http://prometheus.test.com/metrics 是通过ingress访问,接下来我们直接使用pod的ip访问9090端口获取信息
$ kubectl -n monitor get po -o wide
NAME READY STATUS RESTARTS AGE IP NODE NOMINATED NODE READINESS GATES
prometheus-5bc5966ff8-f84vx 1/1 Running 0 129m 10.244.0.26 k8s-master <none> <none>

$ $ curl http://10.244.0.26:9090/metrics
......
# HELP promhttp_metric_handler_requests_total Total number of scrapes by HTTP status code.
# TYPE promhttp_metric_handler_requests_total counter
promhttp_metric_handler_requests_total{code="200"} 258
promhttp_metric_handler_requests_total{code="500"} 0
promhttp_metric_handler_requests_total{code="503"} 0
......

分析一下上面的监控数据信息:

  • 首先是注释的HELP开头的信息,说明该行为指标的帮助信息,通常解释指标的含义
  • 然后是注释的TYPE开头的信息,指明了指标的类型
    • counter 计数器
    • guage 测量器
    • histogram 柱状图
    • summary 采样点分位图统计
  • 最后是非注释的每一行,表示当前采集到的一个监控样本:
    • promhttp_metric_handler_requests_total表明了当前指标的名称
    • 大括号中的标签则反映了当前样本的一些特征和维度
    • 浮点数则是该监控样本的具体值。

TSDB存储工作方式

每次采集到的数据都会被Prometheus以time-series(时间序列)的方式保存到内存中,定期刷新到硬盘。如下所示,可以将time-series理解为一个以时间为X轴的数字矩阵:

1
2
3
4
5
6
7
^
│ . . . . . . . . . . . . . . . . . . . node_cpu{cpu="cpu0",mode="idle"}
│ . . . . . . . . . . . . . . . . . . . node_cpu{cpu="cpu0",mode="system"}
│ . . . . . . . . . . . . . . . . . . node_load1{}
│ . . . . . . . . . . . . . . . . . .
v
<------------------ 时间 ---------------->

在time-series中的每一个点称为一个样本(sample),样本由以下三部分组成:

  • 指标(metric):metric name和描述当前样本特征的labelsets;
  • 时间戳(timestamp):一个精确到毫秒的时间戳;
  • 样本值(value): 一个float64的浮点型数据表示当前样本的值。

TSDB数据格式

在形式上,所有的指标(Metric)都通过如下格式标示:

1
<metric name>{<label name>=<label value>, ...}
  • 指标的名称(metric name)可以反映被监控样本的含义(比如,http_request_total - 表示当前系统接收到的HTTP请求总量)。
  • 标签(label)反映了当前样本的特征维度,通过这些维度Prometheus可以对样本数据进行过滤,聚合等。

TSDB数据更新

Prometheus会定期去targets列表拉取监控数据,存储到TSDB中,并且提供指标查询、分析的语句和接口。这样我们就能获取到比较全面的监控数据,进行分析、报警等。

文章目录
  1. 1. k8s集群监控体系演变史
    1. 1.1. 第一版本:Cadvisor+InfluxDB+Grafana
    2. 1.2. 第二版本: Heapster+InfluxDB+Grafana
    3. 1.3. 第三版本:Metrics-Server + Prometheus
    4. 1.4. 监控接口标准化
  2. 2. Prometheus架构
  3. 3. Prometheus安装
    1. 3.1. docker 启动
    2. 3.2. k8s部署
    3. 3.3. prometheus的数据
  4. 4. 时间序列数据库(TSDB)
    1. 4.1. 初识TSDB
    2. 4.2. TSDB存储工作方式
    3. 4.3. TSDB数据格式
    4. 4.4. TSDB数据更新